Swing trading is a popular trading style that aims to capture short- to medium-term price movements. Among the various tools traders use, Fibonacci retracement stands out as a powerful technique for identifying potential reversal levels. In this guide, we will explore how to effectively use Fibonacci retracement in swing trading, its key strategies, and common mistakes to avoid.
What is Fibonacci Retracement in Swing Trading?
Fibonacci retracement is a technical analysis tool based on the Fibonacci sequence. It helps traders identify key support and resistance levels by measuring price pullbacks within a trend. The most commonly used retracement levels are:
- 23.6%
- 38.2%
- 50.0%
- 61.8%
- 78.6%
These levels indicate potential points where the price may reverse or continue its trend, making them useful for swing traders to plan entry and exit strategies.
How to Use Fibonacci Retracement in Swing Trading
Step 1: Identify the Trend
Before applying Fibonacci retracement, it’s crucial to identify whether the market is trending upwards or downwards. In an uptrend, traders will look for buying opportunities during retracements, whereas in a downtrend, they will seek selling opportunities.
Step 2: Plot Fibonacci Levels
To draw Fibonacci retracement levels:
- Select the swing high (peak) and swing low (trough) on the price chart.
- Apply the Fibonacci retracement tool from the charting software.
- Observe key levels where price might retrace before continuing its primary trend.
Step 3: Confirm with Other Indicators
To enhance accuracy, Fibonacci retracement should be combined with other technical indicators such as:
- Moving Averages – To confirm trend direction.
- Relative Strength Index (RSI) – To check overbought or oversold conditions.
- Candlestick Patterns – To validate reversal signals at key levels.
Step 4: Plan Entry and Exit Points
Once the retracement levels are identified, traders can plan:
- Entry: Buying near the 38.2% or 50.0% levels in an uptrend.
- Stop-loss: Below the 61.8% retracement level to minimize risk.
- Profit Target: Near the previous swing high or an extension level such as 161.8%.
Key Strategies for Swing Trading with Fibonacci Retracement
1. Combining Fibonacci with Trendlines
Drawing trendlines alongside Fibonacci levels can provide additional confirmation. If the retracement level aligns with a trendline, it increases the probability of a successful trade.
2. Using Fibonacci Extensions
Extensions go beyond the usual 100% mark, helping traders project future price targets. Popular extension levels include 127.2% and 161.8%, which indicate where the price may move after breaking through retracement levels.
3. Applying Fibonacci Across Multiple Timeframes
Analyzing Fibonacci retracement on different timeframes (e.g., daily, 4-hour, 1-hour) can offer a broader perspective, aligning short-term trades with longer-term trends.
4. Risk Management with Fibonacci
Using Fibonacci retracement for stop-loss placement helps traders control risk effectively. For example, if the price breaks below the 61.8% retracement level in an uptrend, it may indicate a trend reversal.
Common Mistakes to Avoid
Even experienced traders can fall into traps when using Fibonacci retracement. Here are some mistakes to avoid:
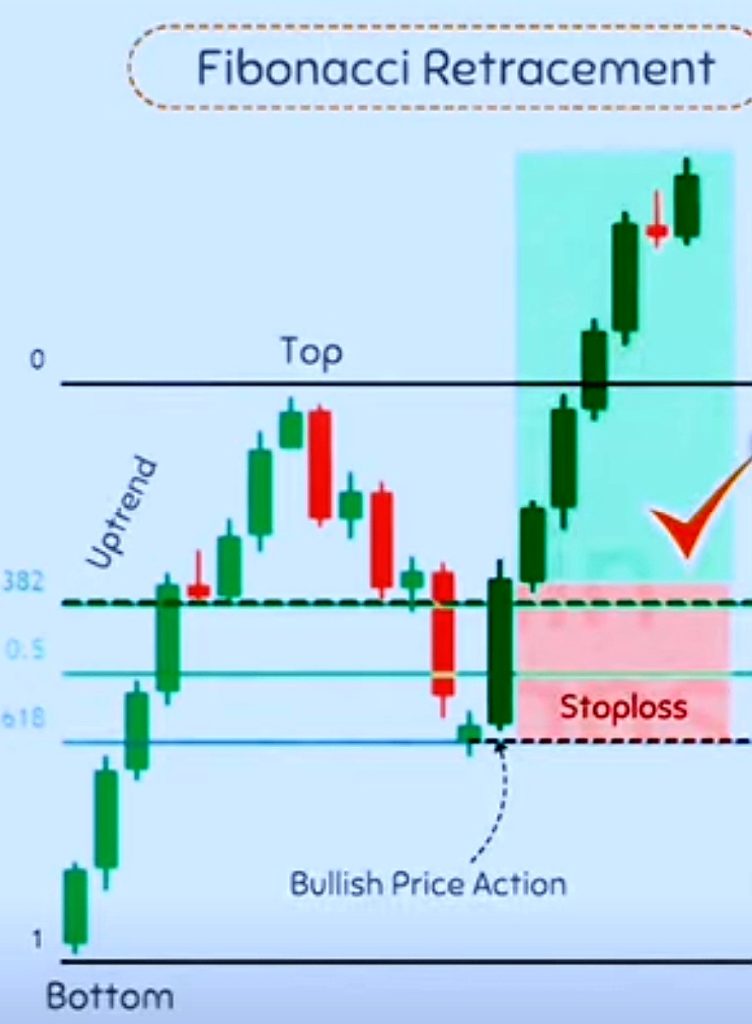
Example of Fibonacci Retracement in Swing Trading
Let’s consider an example of an uptrend in a stock price:
- The stock rises from $50 to $100 (swing low to swing high).
- After reaching $100, the price pulls back to $80 (50% retracement).
- If the price holds above the 50% level and shows bullish confirmation, traders may enter long positions with a stop-loss below $75 (61.8% level).
Chart Representation:
FAQs about Swing Trading with Fibonacci Retracement
1. Is Fibonacci retracement reliable for all market conditions?
Fibonacci works best in trending markets. In ranging markets, its effectiveness is reduced.
2. What is the most important Fibonacci retracement level?
The 61.8% level, also known as the “golden ratio,” is considered the most significant.
3. Can Fibonacci retracement be used for day trading?
Yes, it is effective for intraday trading but requires faster execution and analysis.
4. Should I always wait for price confirmation at Fibonacci levels?
Yes, combining Fibonacci levels with candlestick patterns or volume analysis enhances accuracy.
5. How often should I adjust Fibonacci levels?
Adjust them when a new swing high or low is formed, ensuring accuracy with the latest price action.
Conclusion
Swing trading using Fibonacci retracement is a valuable strategy for identifying potential entry and exit points based on market corrections. By combining it with other technical indicators, managing risk effectively, and avoiding common mistakes, traders can improve their success rates.
For more insights on swing trading, explore our related articles on trend trading and support and resistance.
Outbound Links: