MAFANG ETF has gained significant traction among investors seeking exposure to top-tier technology companies. This article provides an in-depth analysis of MAFANG ETF’s fundamental and technical aspects to help you make informed investment decisions.
Overview of MAFANG ETF
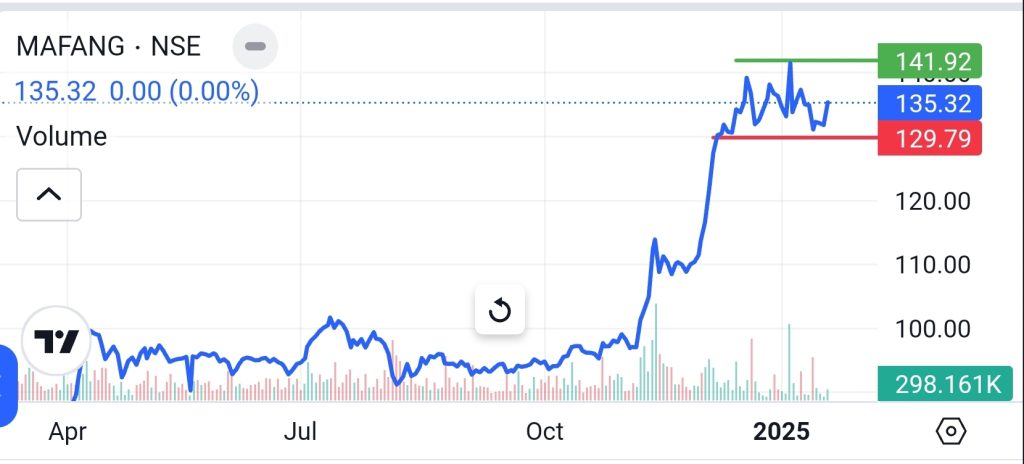
MAFANG ETF is an exchange-traded fund that tracks the NYSE FANG+ Index, offering exposure to high-growth technology and internet-based companies. It has become a popular choice among investors looking to capitalize on the tech sector’s rapid expansion.
Key Details
| Metric | Value |
|---|---|
| Assets Under Management (AUM) | ₹2743.5 Crore |
| Expense Ratio | 0.70% |
| Indicative NAV (iNAV) | ₹113.41 |
| 1-Year Return | 82.84% |
| All-Time Return | 179% |
| Current Price | ₹135 |
Keyphrase: MAFANG ETF offers diversified exposure to top technology companies.
Fundamental Analysis of MAFANG ETF
Recent Performance
MAFANG ETF has delivered stellar returns, with a 1-year performance of 82.84%, significantly outperforming broader market indices. Its all-time returns stand at 179%, reflecting the strength of the underlying assets.
Financial Ratios
Since MAFANG ETF tracks an index, it does not have individual financial statements like traditional stocks. However, analyzing key ratios of the underlying companies can provide valuable insights. Some of the critical metrics include:
- Price-to-Earnings (P/E) Ratio: Evaluating the valuation of constituent companies.
- Price-to-Book (P/B) Ratio: Assessing asset valuation.
- Debt-to-Equity Ratio: Measuring financial stability.
Comparison with Sector Peers
MAFANG ETF has consistently outperformed similar technology-focused ETFs due to its focused allocation and the superior growth prospects of its holdings.
| ETF | 1-Year Return | Expense Ratio |
|---|---|---|
| MAFANG ETF | 82.84% | 0.70% |
| Nasdaq 100 ETF | 55.32% | 0.68% |
| S&P 500 Tech ETF | 47.89% | 0.65% |
Keyphrase: MAFANG ETF has shown consistent growth compared to its peers.
Technical Analysis of MAFANG ETF
Price Trends
MAFANG ETF’s current price is ₹135, showing an upward trajectory with strong support levels. Historical data indicates robust price movement, reflecting investor confidence.
Key Technical Indicators
| Indicator | Value | Signal |
|---|---|---|
| 20-Day EMA | ₹131.98 | Bullish |
| 50-Day EMA | ₹122.06 | Bullish |
| 200-Day SMA | ₹100.76 | Bullish |
| RSI (Relative Strength Index) | 64.30 | Neutral |
| MACD (Moving Average Convergence Divergence) | 4.26 | Bullish |
Support and Resistance Levels
- Support Levels: ₹128, ₹118
- Resistance Levels: ₹140, ₹150
Price Movement Chart
 150 |               *
 140 |              * *
 130 |           * *   *
 120 |         * *       *
 110 |      * *           *
 100 |    *
      ----------------------
         1M   3M   6M   1Y
Keyphrase: MAFANG ETF exhibits strong bullish momentum across key technical indicators.
Market Sentiment and Analyst Ratings
Analyst Ratings
Investment experts have consistently rated MAFANG ETF as a “Strong Buy,” citing its impressive growth potential and diversification across leading tech firms.
Investor Sentiment
Social media platforms and financial forums reflect positive investor sentiment, with many highlighting the ETF’s solid returns and growth potential.
Keyphrase: MAFANG ETF remains a favorite among tech-savvy investors.
Potential Catalysts and Risks
Catalysts Driving Growth
- Technology Sector Expansion: Increasing digitalization and innovation.
- Earnings Growth: Strong performance from constituent companies.
- Macroeconomic Tailwinds: Favorable policies and economic conditions.
Risks to Consider
- Regulatory Challenges: Potential government interventions.
- Market Volatility: Fluctuations due to economic downturns.
- Currency Risk: Exposure to foreign markets may impact returns.
Short-Term Trading Opportunities
For short-term traders, MAFANG ETF presents lucrative opportunities, supported by:
- RSI Near 64: Indicates potential for further upside.
- MACD Positive Crossover: Signals buying momentum.
- Bollinger Bands Expansion: Suggests increased volatility and breakout potential.
Trading Strategy
- Entry Point: Around ₹130
- Target Price: ₹140
- Stop Loss: ₹125
Long-Term Investment Potential
Given the ETF’s strong historical performance and exposure to leading technology giants, MAFANG ETF presents a compelling case for long-term investors seeking growth-oriented portfolios.
Growth Projections
Market analysts forecast continued growth for the ETF, driven by the sustained expansion of the tech sector and favorable market conditions.
Keyphrase: MAFANG ETF is an ideal choice for long-term wealth accumulation.
Conclusion: Should You Invest in MAFANG ETF?
Considering both fundamental and technical aspects, MAFANG ETF appears to be a “Buy” for growth-focused investors. The ETF offers a unique opportunity to gain exposure to the world’s top tech companies with a proven track record of high returns.
Investment Recommendation
| Timeframe | Recommendation |
|---|---|
| Short-Term | Buy |
| Long-Term | Strong Buy |
Investors should keep an eye on market developments and sector trends to maximize their returns from MAFANG ETF.
Keyphrase: MAFANG ETF continues to provide strong returns and growth opportunities.
visit our other blog posts.