Introduction
Support and resistance are fundamental concepts in technical analysis that help traders identify potential price reversal points. These levels act as barriers where buying or selling pressure tends to change the direction of an asset’s price. Traders use support and resistance to determine entry and exit points, improving their chances of making profitable trades. In this blog, we’ll explore the importance of support and resistance, how to identify these levels, key trading strategies, and common mistakes to avoid.
What is Support and Resistance?
Support refers to a price level where an asset tends to find buying interest, preventing it from falling further. It’s considered a floor where demand outweighs supply. On the other hand, resistance is a price level where selling pressure prevents the asset from rising further, acting as a ceiling where supply exceeds demand.
These levels are formed due to market psychology, where traders remember historical price points and act accordingly. When a stock price nears support, buyers step in; when it approaches resistance, sellers take control.
Key Characteristics:
- Support Level: A price area where downward movements are likely to pause or reverse.
- Resistance Level: A price area where upward movements may stall or reverse.
- Breakout: When price moves beyond these levels, potentially signaling a trend continuation.
Types of Support and Resistance
There are several types of support and resistance levels that traders commonly use:
- Horizontal Levels:
- These are static levels where price historically reversed multiple times.
- Example: A stock repeatedly bouncing off the $50 level.
- Trendlines:
- Support and resistance can be dynamic when connected through trendlines.
- Upward or downward sloping lines based on price action.
- Moving Averages:
- Indicators like the 50-day or 200-day moving averages often act as support or resistance.
- Dynamic and change as the price fluctuates.
- Fibonacci Retracement Levels:
- Based on mathematical ratios (e.g., 38.2%, 50%, 61.8%), these levels help identify potential reversal zones.
How to Identify Support and Resistance Levels
Traders can identify these levels using various methods:
- Historical Price Data:
- Analyzing past price action to identify areas where price repeatedly reversed.
- Volume Analysis:
- High trading volumes around certain price levels indicate strong support or resistance.
- Psychological Levels:
- Round numbers (e.g., $100, $500) often act as psychological barriers.
- Chart Patterns:
- Patterns such as double tops/bottoms and head-and-shoulders help confirm key levels.
Key Strategies for Trading Support and Resistance
- Range Trading Strategy
- In a sideways market, traders buy at support and sell at resistance.
- Example: Buy a stock near $100 support and sell near $110 resistance.
- Risk Management: Place stop-loss slightly below support or above resistance.
- Breakout Trading Strategy
- Enter trades when price breaks above resistance or below support with strong volume.
- Example: If a stock breaks above $110 resistance, enter a long position expecting further gains.
- Confirmation Tip: Look for high trading volume to confirm breakouts.
- Pullback Strategy
- After a breakout, price often returns to the broken level before continuing the trend.
- Example: If resistance at $110 is broken, wait for a pullback to $110 to enter.
- Patience Required: Avoid jumping into trades immediately after breakouts.
Common Mistakes Traders Make
While support and resistance can be powerful tools, traders often make mistakes such as:
- Misidentifying Key Levels:
- Relying on random price points instead of well-tested levels.
- Ignoring Confirmation Signals:
- Entering trades without waiting for volume or price action confirmation.
- Over-reliance on Support/Resistance:
- Using them in isolation without considering other indicators (e.g., RSI, MACD).
- Emotional Trading:
- Exiting trades too early due to fear or holding on too long due to greed.
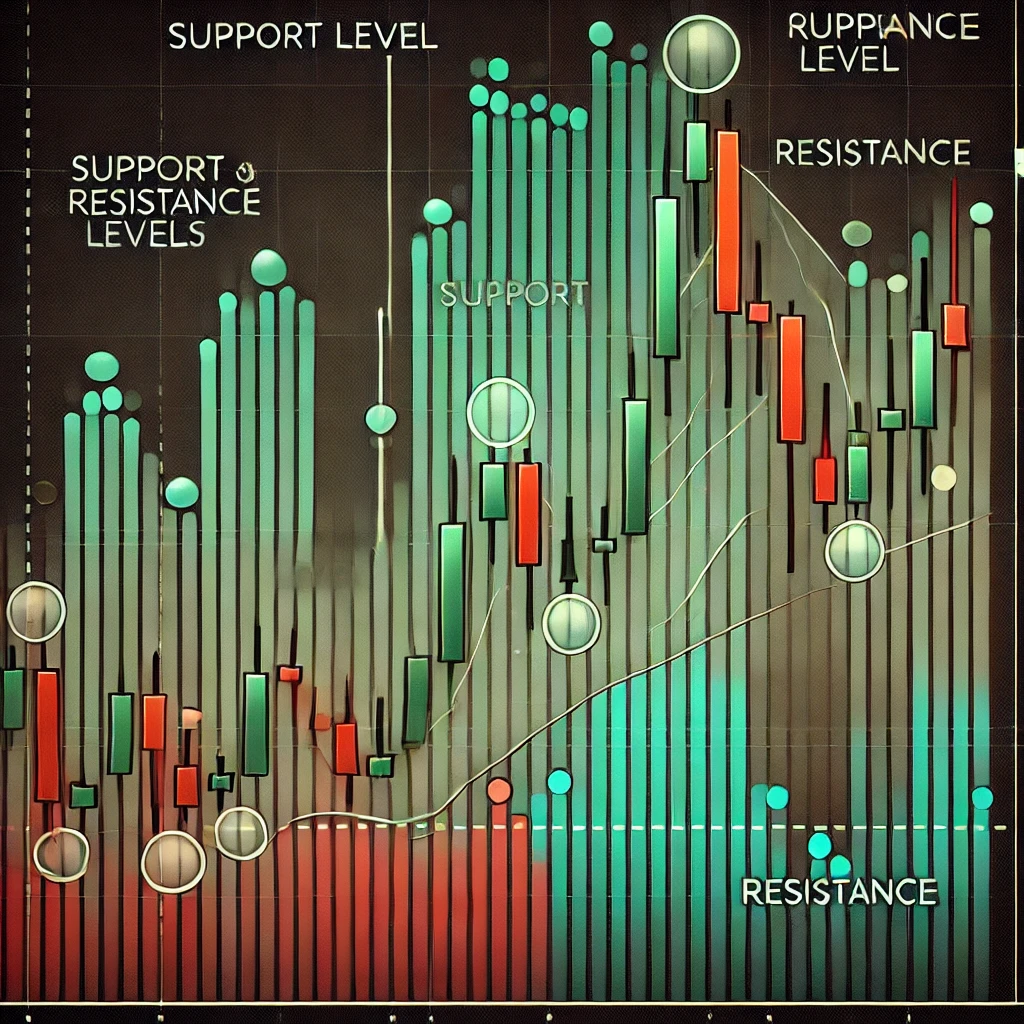
Charts and Examples
Below is an example of a stock trading within a range, with clear support and resistance levels:
Conclusion
Support and resistance are crucial tools for traders to identify market trends, reversals, and breakout opportunities. By mastering these concepts, traders can make better decisions and manage risks effectively. However, it’s essential to combine them with other technical indicators and maintain discipline in trading.
Would you like to explore more advanced trading strategies? Keep learning and refining your skills for long-term success in the financial markets.